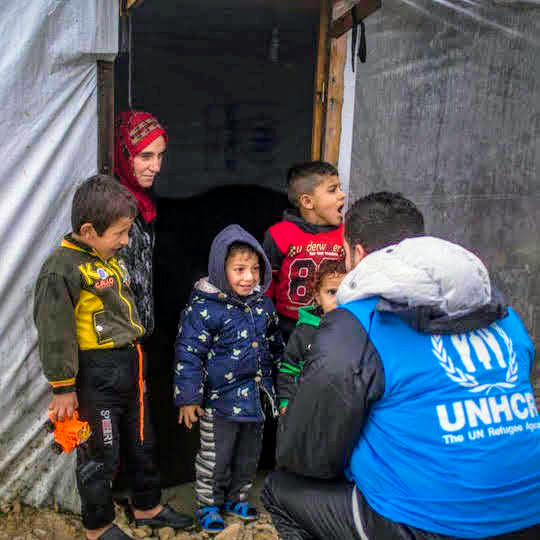
Vulnerability Assessment of Syrian Refugees in Lebanon, 2018
Lebanon, 2018
Get Microdata
Reference ID
UNHCR_LBN_2018_VASYR_v2.1
Producer(s)
UNHCR, WFP, UNICEF
Metadata
Created on
Dec 10, 2019
Last modified
May 20, 2020
Page views
80926
Downloads
1306
- Data files
- UNHCR_LBN_2018_VASyR_HH
- UNHCR_LBN_2018_VASyR_Ind
What is the main source of Household drinking water? (drink_water_source)
Data file: UNHCR_LBN_2018_VASyR_HH
Overview
Valid:
4444
Invalid:
0
Type:
Discrete
Decimal:
0
Width:
12
Range:
1 - 16
Format:
Numeric
Questions and instructions
Categories
| Value | Category | Cases | |
|---|---|---|---|
| 1 | Bottled mineral water | 1876 |
42.2%
|
| 2 | Household water tap/water network <2 hrs per day | 329 |
7.4%
|
| 3 | Household water tap/water network >2 hrs per day | 725 |
16.3%
|
| 4 | Other (specify) | 55 |
1.2%
|
| 5 | Piped water to yard/plot | 38 |
0.9%
|
| 6 | Protected borehole | 61 |
1.4%
|
| 7 | Protected spring | 169 |
3.8%
|
| 8 | Protected well | 432 |
9.7%
|
| 9 | Public/shared water stand/taps | 375 |
8.4%
|
| 10 | Rainwater | 5 |
0.1%
|
| 11 | Surface water | 1 |
0%
|
| 12 | Unprotected borehole | 2 |
0%
|
| 13 | Unprotected spring | 23 |
0.5%
|
| 14 | Unprotected well | 34 |
0.8%
|
| 15 | Water tank/trucked water (non-UN/NGO private provider) | 202 |
4.5%
|
| 16 | Water tank/trucked water (UN/NGO provided) | 117 |
2.6%
|
Warning: these figures indicate the number of cases found in the data file. They cannot be interpreted as summary statistics of the population of interest.
