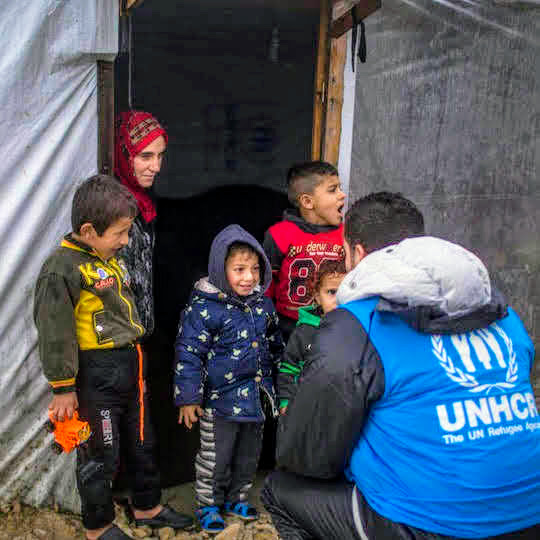
Multi-Purpose Cash Assistance: Impact Evaluation on the Well-Being of Syrian Refugees - 2020
Lebanon, 2018 - 2019
Get Microdata
Reference ID
CAMEALEON_LBN_2020_MPC_v2.1
Producer(s)
CAMEALEON
Metadata
Created on
Jan 19, 2021
Last modified
Jan 19, 2021
Page views
159599
Downloads
1158
If no, why? (EMP3)
Data file: CAMEALEON_wave1_ind
Overview
Valid:
14136
Invalid:
8746
Type:
Discrete
Decimal:
0
Width:
12
Range:
1 - 15
Format:
Numeric
Questions and instructions
Categories
| Value | Category | Cases | |
|---|---|---|---|
| 1 | Afraid/ Unable to leave the place of residence | 77 |
0.5%
|
| 2 | Dont Know | 27 |
0.2%
|
| 3 | Fears to be detained because is illegal | 21 |
0.1%
|
| 4 | Has a disability or sick | 1003 |
7.1%
|
| 5 | Has Independent Means | 26 |
0.2%
|
| 6 | Housewife /pregnant/ brings up children | 3140 |
22.2%
|
| 7 | Lost hope of finding a job so gave up | 543 |
3.8%
|
| 8 | Not allowed to work legally | 128 |
0.9%
|
| 9 | Other | 210 |
1.5%
|
| 10 | Refuse to answer | 3 |
0%
|
| 11 | Retired/pensioner/old | 490 |
3.5%
|
| 12 | Social and family beliefs/pressure | 514 |
3.6%
|
| 13 | Student | 3351 |
23.7%
|
| 14 | Too young | 4597 |
32.5%
|
| 15 | Works but on vacation/ sick leave | 6 |
0%
|
| Sysmiss | 8746 |
Warning: these figures indicate the number of cases found in the data file. They cannot be interpreted as summary statistics of the population of interest.
